A) higher unemployment and lower output.
B) higher unemployment and higher output.
C) lower unemployment and lower output.
D) lower unemployment and higher output.
F) None of the above
Correct Answer

verified
Correct Answer
verified
Multiple Choice
Figure 35-2
Use the pair of diagrams below to answer the following questions. 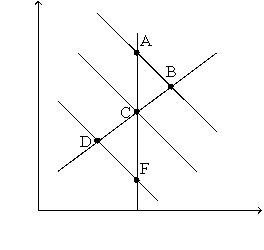
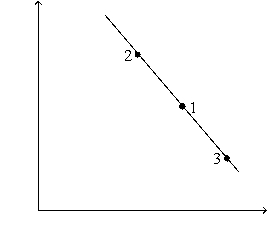 -Refer to Figure 35-2.If the economy starts at C and 1,then in the short run,a decrease in the money supply moves the economy to
A) E and 1.
B) D and 2.
C) D and 3.
D) None of the above is correct.
F) B) and C)
Correct Answer

verified
Correct Answer
verified
True/False
In the long run,the inflation rate depends primarily on the growth rate of the money supply..
B) False
Correct Answer

verified
Correct Answer
verified
Multiple Choice
In the long run,if the Fed decreases the rate at which it increases the money supply,
A) inflation will be lower.
B) unemployment will be higher.
C) real GDP will be lower.
D) All of the above are correct.
F) B) and D)
Correct Answer

verified
Correct Answer
verified
Multiple Choice
If inflation expectations rise,the short-run Phillips curve shifts
A) right,so that at any inflation rate unemployment is higher in the short run than before.
B) left,so that at any inflation rate unemployment is higher in the short run than before.
C) right,so that at any inflation rate unemployment is lower in the short run than before.
D) left,so that at any inflation rate unemployment is lower in the short run than before.
F) B) and C)
Correct Answer

verified
Correct Answer
verified
Multiple Choice
Figure 35-3 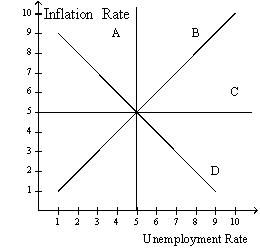 Refer to figure 35-3.In this order,which curve is a long-run Phillips curve and which is a short-run Phillips curve?
a.
A,B
b.
A,D
c.
C,B
d.
None of the above is correct.
ANS: B DIF: 1 REF: 35-2 NAT: Analytic
LOC: Unemployment and inflation TOP: Short-run Phillips curve | Long-run Phillips curve
MSC: Definitional
-Which of the following is upward sloping?
A) both the long-run Phillips curve and the long-run aggregate supply curve
B) neither the long-run Phillips curve nor the long-run aggregate supply curve
C) the long-run Phillips curve,but not the long-run aggregate supply curve
D) the short-run Phillips curve,but not the long-run aggregate supply curve
F) A) and D)
Correct Answer

verified
Correct Answer
verified
Multiple Choice
Proponents of rational expectations argued that the sacrifice ratio
A) could be high because it was rational for people not to immediately change their expectations.
B) could be high because people might adjust their expectations quickly if they found anti-inflation policy credible.
C) could be low because it was rational for people not to immediately change their expectations.
D) could be low because people might adjust their expectations quickly if they found anti-inflation policy credible.
F) A) and B)
Correct Answer

verified
Correct Answer
verified
True/False
The sacrifice ratio is the percentage point increase in the unemployment rate created in the process of reducing inflation by one percentage point.
B) False
Correct Answer

verified
Correct Answer
verified
Multiple Choice
Which of the following would shift the long-run Phillips curve right?
A) expansionary fiscal policy
B) an increase in the inflation rate
C) increases in unemployment compensation
D) None of the above is correct.
F) B) and C)
Correct Answer

verified
Correct Answer
verified
True/False
If the Fed were to increase the money supply,inflation would increase and unemployment would decrease in the short run.
B) False
Correct Answer

verified
Correct Answer
verified
Multiple Choice
The experience of the Volcker disinflation of the early 1980s
A) generally increased estimates of the sacrifice ratio.
B) generally decreased estimates of the sacrifice ratio.
C) clearly refuted the predictions of the proponents of rational expectations.
D) clearly refuted the predictions of the opponents of rational expectations.
F) A) and D)
Correct Answer

verified
Correct Answer
verified
Multiple Choice
An event that directly affects firms' costs of production and thus the prices they charge is called
A) a Phillips contraction.
B) an inflationary spiral.
C) a demand shock.
D) a supply shock.
F) B) and D)
Correct Answer

verified
Correct Answer
verified
Multiple Choice
In the long run a reduction in the money supply growth rate effects
A) the inflation rate and the natural rate of unemployment.
B) the inflation rate but not the natural rate of unemployment.
C) neither the inflation rate nor the natural rate of unemployment.
D) the natural rate of unemployment,but not the inflation rate.
F) B) and C)
Correct Answer

verified
Correct Answer
verified
Multiple Choice
Which of the following would reduce the natural rate of unemployment?
A) both an increase in the rate of money growth and increased unemployment compensation
B) an increase in the rate of money growth but not increased unemployment compensation
C) an increase in unemployment compensation but not an increase in the rate of money growth.
D) neither an increase in unemployment compensation nor an increase in the rate of money growth.
F) C) and D)
Correct Answer

verified
Correct Answer
verified
Multiple Choice
Figure 35-1.The left-hand graph shows a short-run aggregate-supply (SRAS) curve and two aggregate-demand (AD) curves.On the right-hand diagram,U represents the unemployment rate. 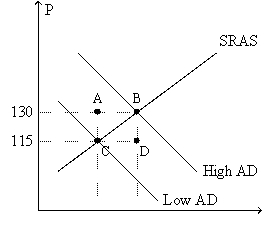
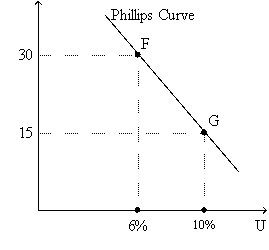 -Refer to Figure 35-1.Assuming the price level in the previous year was 100,point F on the right-hand graph corresponds to
A) point A on the left-hand graph.
B) point B on the left-hand graph.
C) point C on the left-hand graph.
D) point D on the left-hand graph.
F) None of the above
Correct Answer

verified
Correct Answer
verified
Multiple Choice
Figure The Economy in 2008 In the first half of June 2008 the effects of a housing and financial crisis and an increase in world prices of oil and foodstuffs were impacting the economy. -Refer to The Economy in 2008.In the short run the increased prices of world commodities
A) raise both the price level and output.
B) raise the price level and reduce output.
C) reduce the price level and raise output.
D) reduce both the price level and output.
F) B) and D)
Correct Answer

verified
Correct Answer
verified
Multiple Choice
Figure 35-1.The left-hand graph shows a short-run aggregate-supply (SRAS) curve and two aggregate-demand (AD) curves.On the right-hand diagram,U represents the unemployment rate. 
 -Refer to Figure 35-1.Assuming the price level in the previous year was 100,point G on the right-hand graph corresponds to
A) point A on the left-hand graph.
B) point B on the left-hand graph.
C) point C on the left-hand graph.
D) point D on the left-hand graph.
F) None of the above
Correct Answer

verified
Correct Answer
verified
Multiple Choice
Figure 35-1.The left-hand graph shows a short-run aggregate-supply (SRAS) curve and two aggregate-demand (AD) curves.On the right-hand diagram,U represents the unemployment rate. 
 -Refer to Figure 35-1.What is measured along the horizontal axis of the left-hand graph?
A) the wage rate
B) the inflation rate
C) employment
D) output
F) A) and B)
Correct Answer

verified
Correct Answer
verified
True/False
An increase in inflation expectations shifts the short-run Phillips curve right and has no effect on the long-run Phillips curve.
B) False
Correct Answer

verified
Correct Answer
verified
Multiple Choice
If policymakers decrease aggregate demand,then in the short run the price level
A) falls and unemployment rises.
B) and unemployment fall.
C) and unemployment rise.
D) rises and unemployment falls.
F) All of the above
Correct Answer

verified
Correct Answer
verified
Showing 241 - 260 of 306
Related Exams