A) 8.8%
B) 6.2%
C) 93.8%
D) 5.4%
F) A) and B)
Correct Answer

verified
Correct Answer
verified
Multiple Choice
A minimum wage that is above the equilibrium wage is:
A) an example of a price floor.
B) an efficiency wage.
C) a labor union negotiated wage.
D) an unemployment benefit.
F) None of the above
Correct Answer

verified
Correct Answer
verified
Multiple Choice
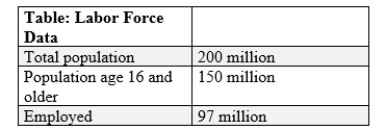
(Table: Employment Data) The number of persons in the labor force is _____ million. 
A) 33.
B) 33
C) 32.
D) 32
E) 31.
F) 31
G) 22.
H) 22
J) All of the above
Correct Answer

verified
Correct Answer
verified
Multiple Choice
Cyclical unemployment is a result of _____.
A) recessions and economic downturns
B) recessions and economic downturns.
C) efficiency wages
D) efficiency wages.
E) union wages
F) union wages.
G) the minimum wage.
H) the minimum wage
J) C) and D)
Correct Answer

verified
Correct Answer
verified
Multiple Choice
Which of following people can be classified as cyclically unemployed?
A) Ben, who worked in an auto assembly plant but was laid off when the company downsized due to poor market conditions
B) Thomas, who works as an online customer service agent for a company in a different country
C) Fred, who was fired for shirking on his job as a forklift operator
D) Ted, who left his previous job in order to be a stay-at-home parent for three years and now needs retraining in order to have the necessary skills to secure employment in his field
F) A) and C)
Correct Answer

verified
Correct Answer
verified
Multiple Choice
(Figure: The Minimum Wage) Use Figure: The Minimum Wage. Which point on the x-axis would be a binding minimum wage?
A) P1.
B) P1
C) P2.
D) P2
E) P3
F) P3.
G) zero.
H) zero
J) A) and E)
Correct Answer

verified
Correct Answer
verified
Multiple Choice
The table shows statistics for three Canadian cities at several different points in time. What was the number of unemployed people (in thousands) in Montreal in January 2009?
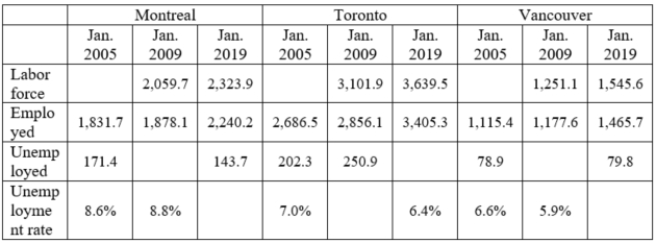
A) 2,059.7
B) 1,878.1
C) 171.4
D) 181.6
F) C) and D)
Correct Answer

verified
Correct Answer
verified
Essay
Suppose a labor market is described by the demand equation Qd = 35 - 2w and Qs = -10 + w, where Qd is the quantity demanded of labor, Qs is the quantity supplied of labor, and w is the wage (in dollars). Using this information, answer the following questions: (a) What is the equilibrium wage in this market? (b) If the government institutes a minimum wage of $16, how many people are willing to work in this market? (c) If the government institutes a minimum wage of $16, how many people will be unemployed in this market?
Correct Answer

verified
Correct Answer
verified
Multiple Choice
(Table: Employment Data) The unemployment rate is _____. 
A) 6.25%
B) 6.25%.
C) 6.45%
D) 6.45%.
E) 9.09%.
F) 9.09%
G) 9.37%.
H) 9.37%
J) E) and G)
Correct Answer

verified
Correct Answer
verified
Multiple Choice
Refer to the following table that shows monthly data for Japan. What was the total number of people (in millions) in the labor force in March 2017?
A) 66.7 million
B) 67.2 million
C) 67.5 million
D) 68.6 million
F) B) and D)
Correct Answer

verified
Correct Answer
verified
Multiple Choice
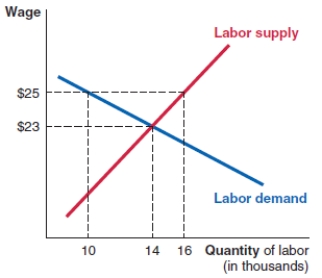
Consider the graph of the labor market shown here. A wage rate of $25 could be an example of:
(i) an efficiency wage.
(ii) a minimum wage.
(iii) a wage rate negotiated by a labor union.
(iv) hysteresis.
A) (ii) and (iii) only
B) (iv) only
C) (i) , (ii) , (iii) , and (iv)
D) (i) , (ii) , and (iii)
F) C) and D)
Correct Answer

verified
Correct Answer
verified
Multiple Choice
Which of the following is a reason that male labor force participation has declined over the last several decades in the United States?
A) more men opting to retire
B) the majority of men looking for jobs outside the United States
C) a lack of available jobs
D) lower minimum wage rates
F) A) and B)
Correct Answer

verified
Correct Answer
verified
Multiple Choice
David is looking for a full-time job in the insurance industry. He is able to find only a 10-hour per week job as a fill-in insurance agent. Davis can be described as:
A) unemployed.
B) a discouraged worker.
C) a marginally attached worker.
D) an involuntary part-time worker.
F) All of the above
Correct Answer

verified
Correct Answer
verified
Multiple Choice
Consider these four graphs of the labor market, showing four different minimum wage levels. Which graph(s) shows a wage level where there is no unemployment?
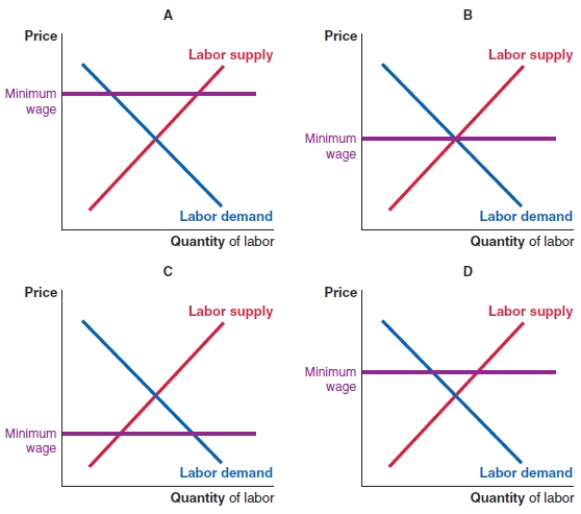
A) graphs A and D
B) graph B
C) graphs A and C
D) graph D
F) A) and D)
Correct Answer

verified
Correct Answer
verified
Multiple Choice
An underemployed person is one who is:
A) employed in the underground economy.
B) working but whose skills are not fully utilized.
C) retired or outside of the labor force.
D) cyclically unemployed.
F) B) and C)
Correct Answer

verified
Correct Answer
verified
Multiple Choice
Structural unemployment is unemployment:
A) due to a temporary downturn in the economy.
B) due to the time it takes for employers to search for workers and for workers to search for jobs.
C) that occurs because wages don't fall to bring labor demand and labor supply into equilibrium.
D) that occurs because of seasonal changes.
F) A) and B)
Correct Answer

verified
Correct Answer
verified
Multiple Choice
Cyclical unemployment is unemployment:
A) due to a temporary downturn in the economy.
B) due to the time it takes for employers to search for workers and for workers to search for jobs.
C) that occurs because wages don't fall to bring labor demand and labor supply into equilibrium.
D) that occurs because of seasonal changes.
F) All of the above
Correct Answer

verified
Correct Answer
verified
Multiple Choice
Which of following people can be classified as frictionally unemployed?
A) Tex, who has returned to a full-time MBA program so that he can improve his earning potential
B) Dorothea, who is training to be a pilot but is currently working part-time as an Uber driver
C) Nancy, who is currently unemployed, lives in a town where telecommunications are poor, and cannot find proper information on available jobs
D) Brandon, who has no idea what career he wants to follow and has no working experience
F) All of the above
Correct Answer

verified
Correct Answer
verified
Short Answer
Consider the labor market shown here. Suppose the government enacts a minimum wage of $16. Using this figure, answer the following questions:
(a) How many workers are employed after implementation of the minimum wage?
(b) How many workers are available to work after the minimum wage is implemented?
(c) After implementation of the minimum wage, does the number of workers who are willing to work increase or decrease? By how many workers?
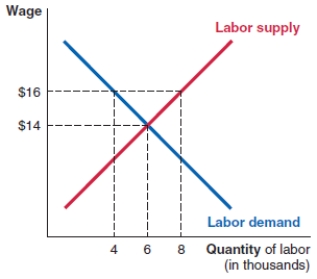
Correct Answer

verified
Correct Answer
verified
Multiple Choice
If the government increases the length and amount of unemployment benefits, the unemployment rate will most likely _____.
A) fall, because more people will obtain jobs.
B) fall, because more people will obtain jobs
C) increase, because the benefits of being unemployed will rise
D) increase, because the benefits of being unemployed will rise.
E) stay the same, because the unemployed will not be affected.
F) stay the same, because the unemployed will not be affected
G) increase, because many of the unemployed will leave the labor force.
H) increase, because many of the unemployed will leave the labor force
J) B) and D)
Correct Answer

verified
Correct Answer
verified
Showing 61 - 80 of 167
Related Exams